Sven Slootweg (soft-deprecated) @joepie91@pixie.town
- Future new account
- @joepie91@slightly.tech
- Matrix
- @joepie91:pixie.town
- Pronouns
- they/them, he/him, whatever, it's not like I have any idea either 🙃
In the process of moving to @joepie91. This account will stay active for the foreseeable future! But please also follow the other one.
Technical debt collector and general hype-hater. Early 30s, non-binary, ND, poly, relationship anarchist, generally queer.
- No alt text (request) = no boost.
- Boosts OK for all boostable posts.
- DMs are open.
- Flirting welcome, but be explicit if you want something out of it!
- The devil doesn't need an advocate; no combative arguing in my mentions.
Sometimes horny on main (behind CW), very much into kink (bondage, freeuse, CNC, and other stuff), and believe it or not, very much a submissive bottom :p
My spoons are limited, so I may not always have the energy to respond to messages.
Strong views about abolishing oppression, hierarchy, agency, and self-governance - but I also trust people by default and give them room to grow, unless they give me reason not to. That all also applies to technology and how it's built.
Joined Aug 2019
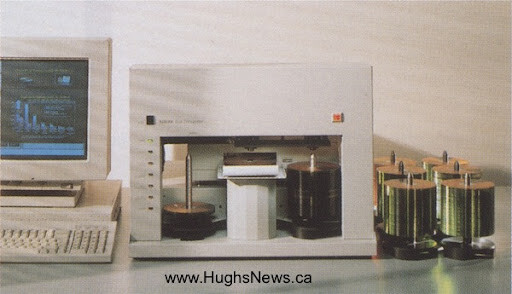
TIL about the Kodak Disc Transporter, which seems to have been a peripheral you could connect to your computer back in the day to automatically load and unload CD-Rs from your computer as you were burning them?
Today, I'm practicing with mesh gradients in Inkscape. Which are cool but damn, Inkscape doesn't exactly make them easy...
(Original silhouette by Andreas 06 on Wikimedia Commons; the cutting up into parts and 'texturing' is my work)
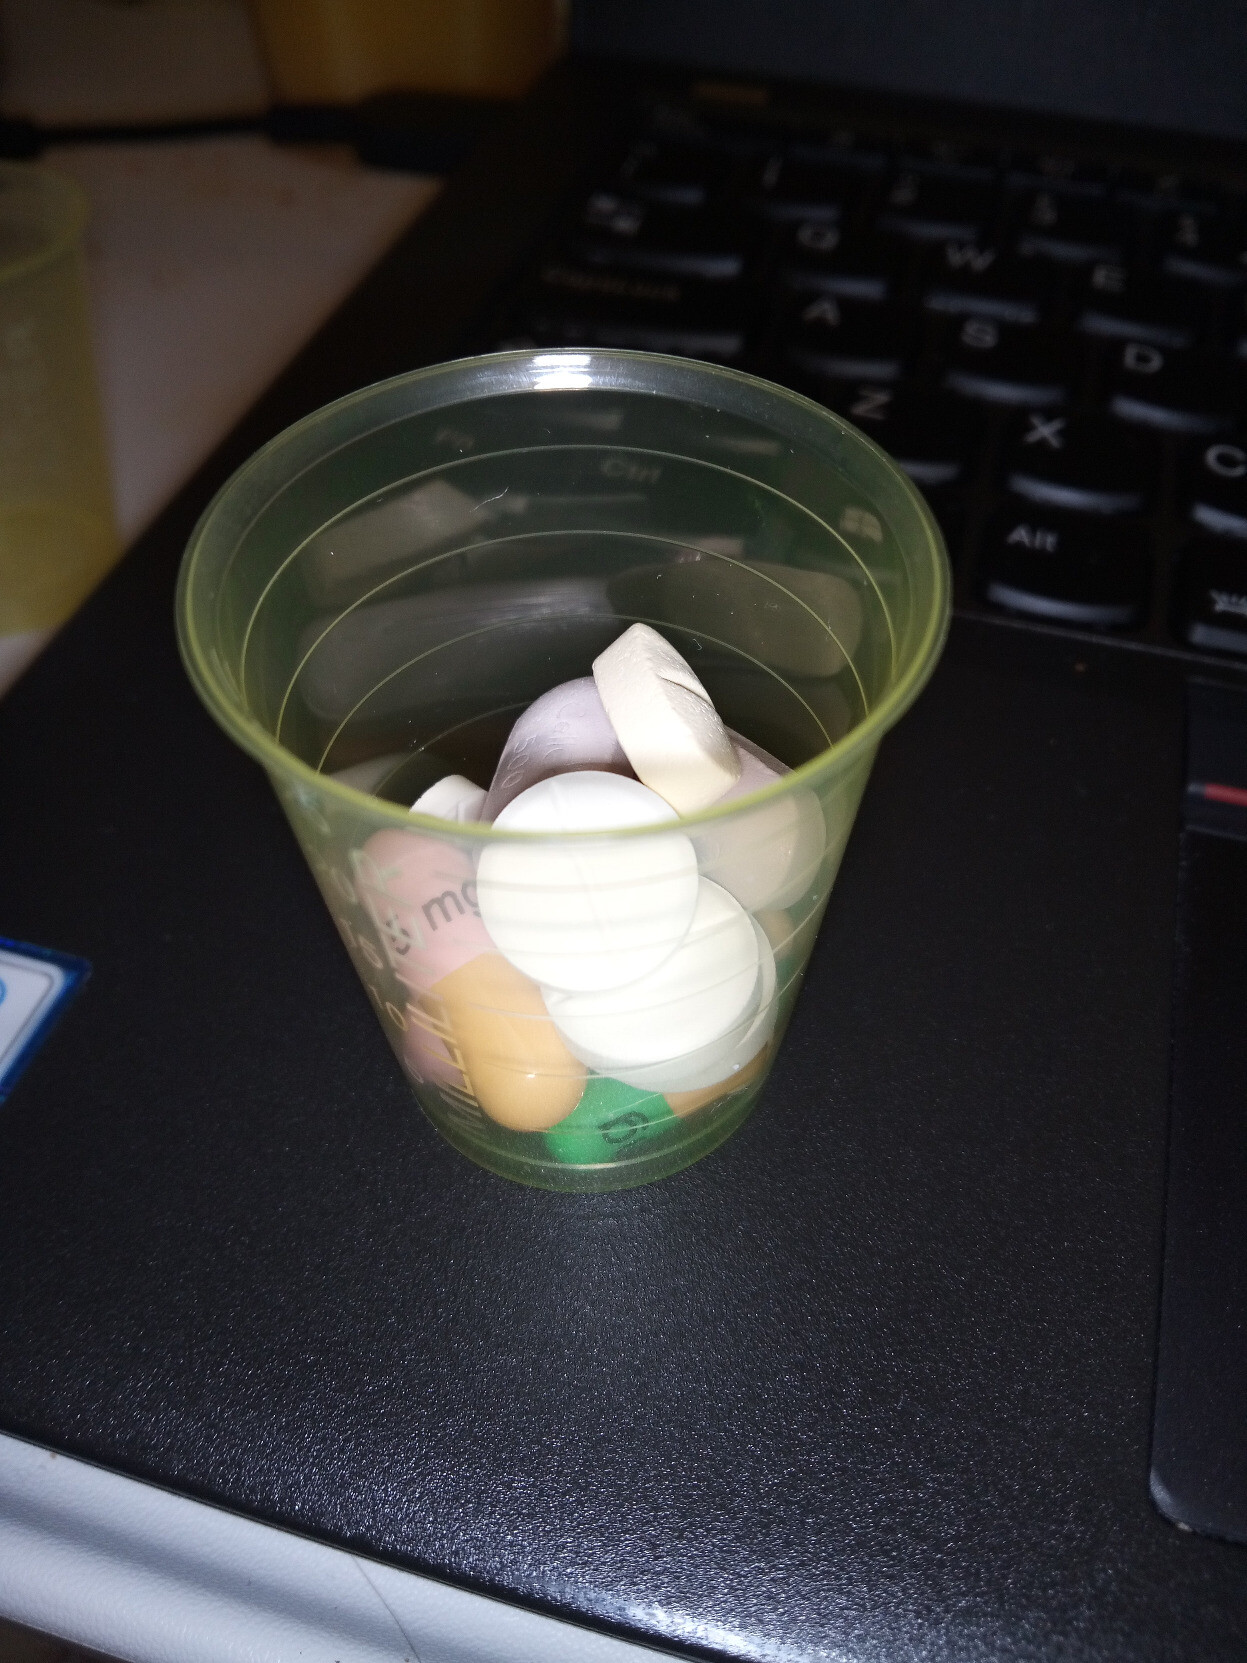
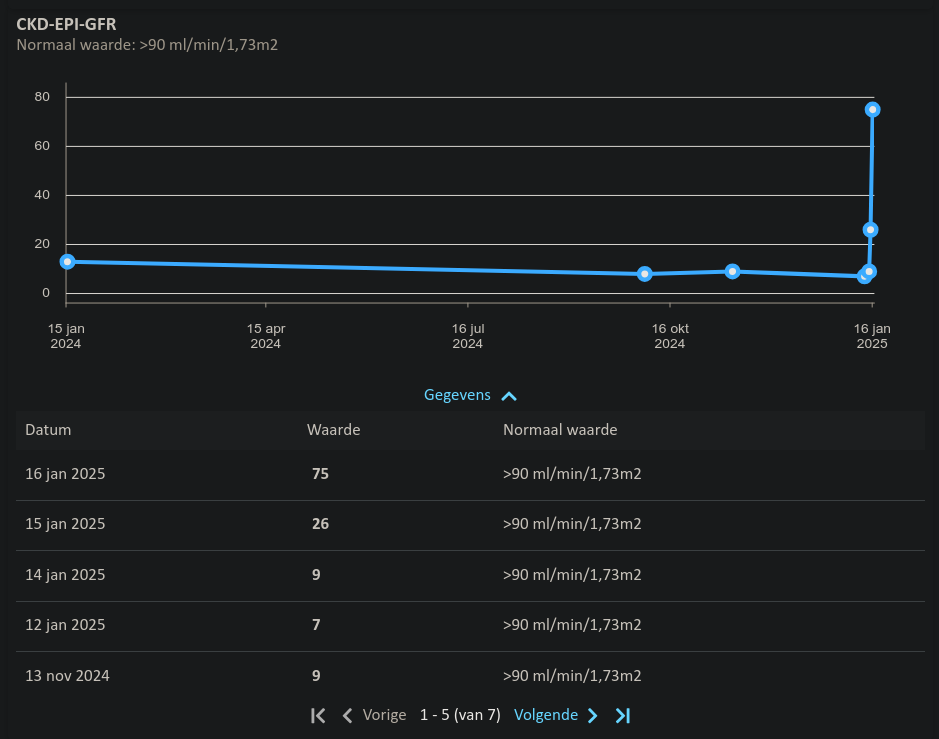
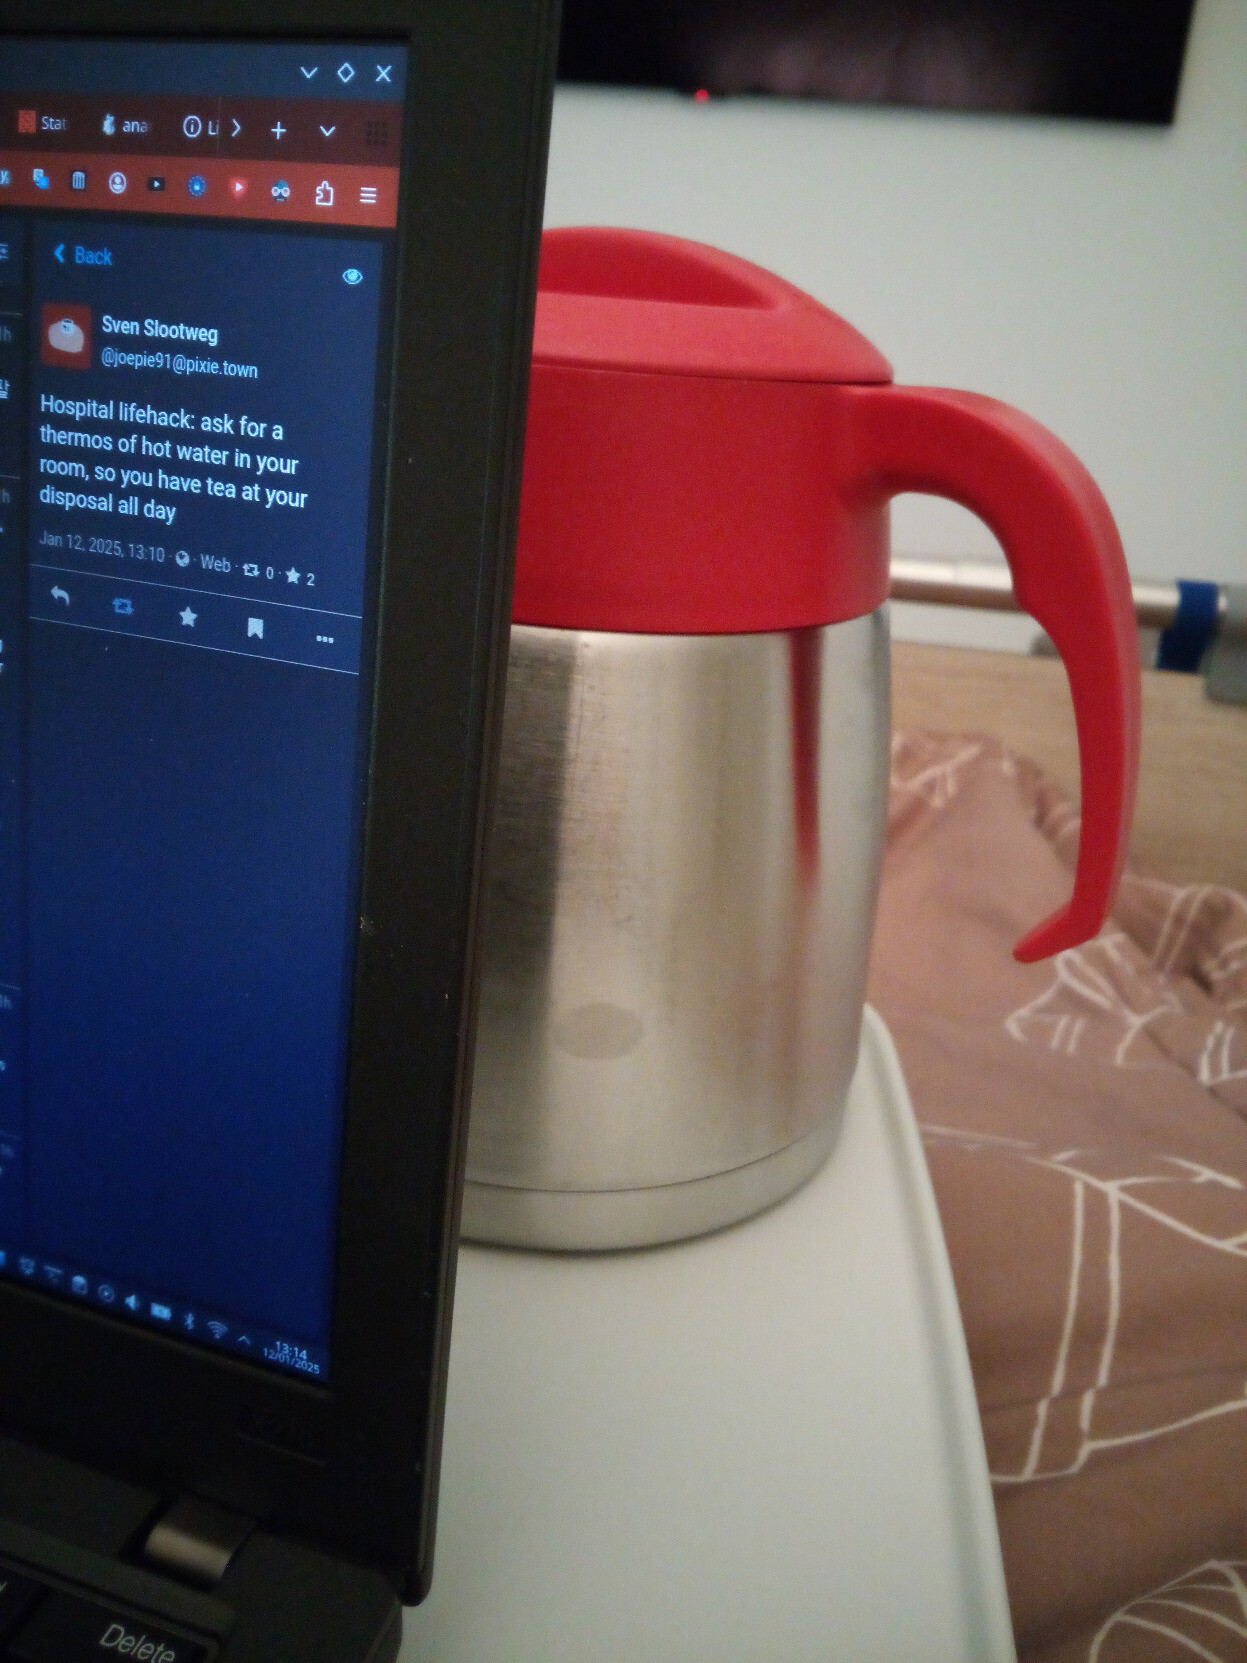
health, meds
So this is what my post-transplantation morning medication looks like now (which is one of four medication moments, though it is the biggest pile)
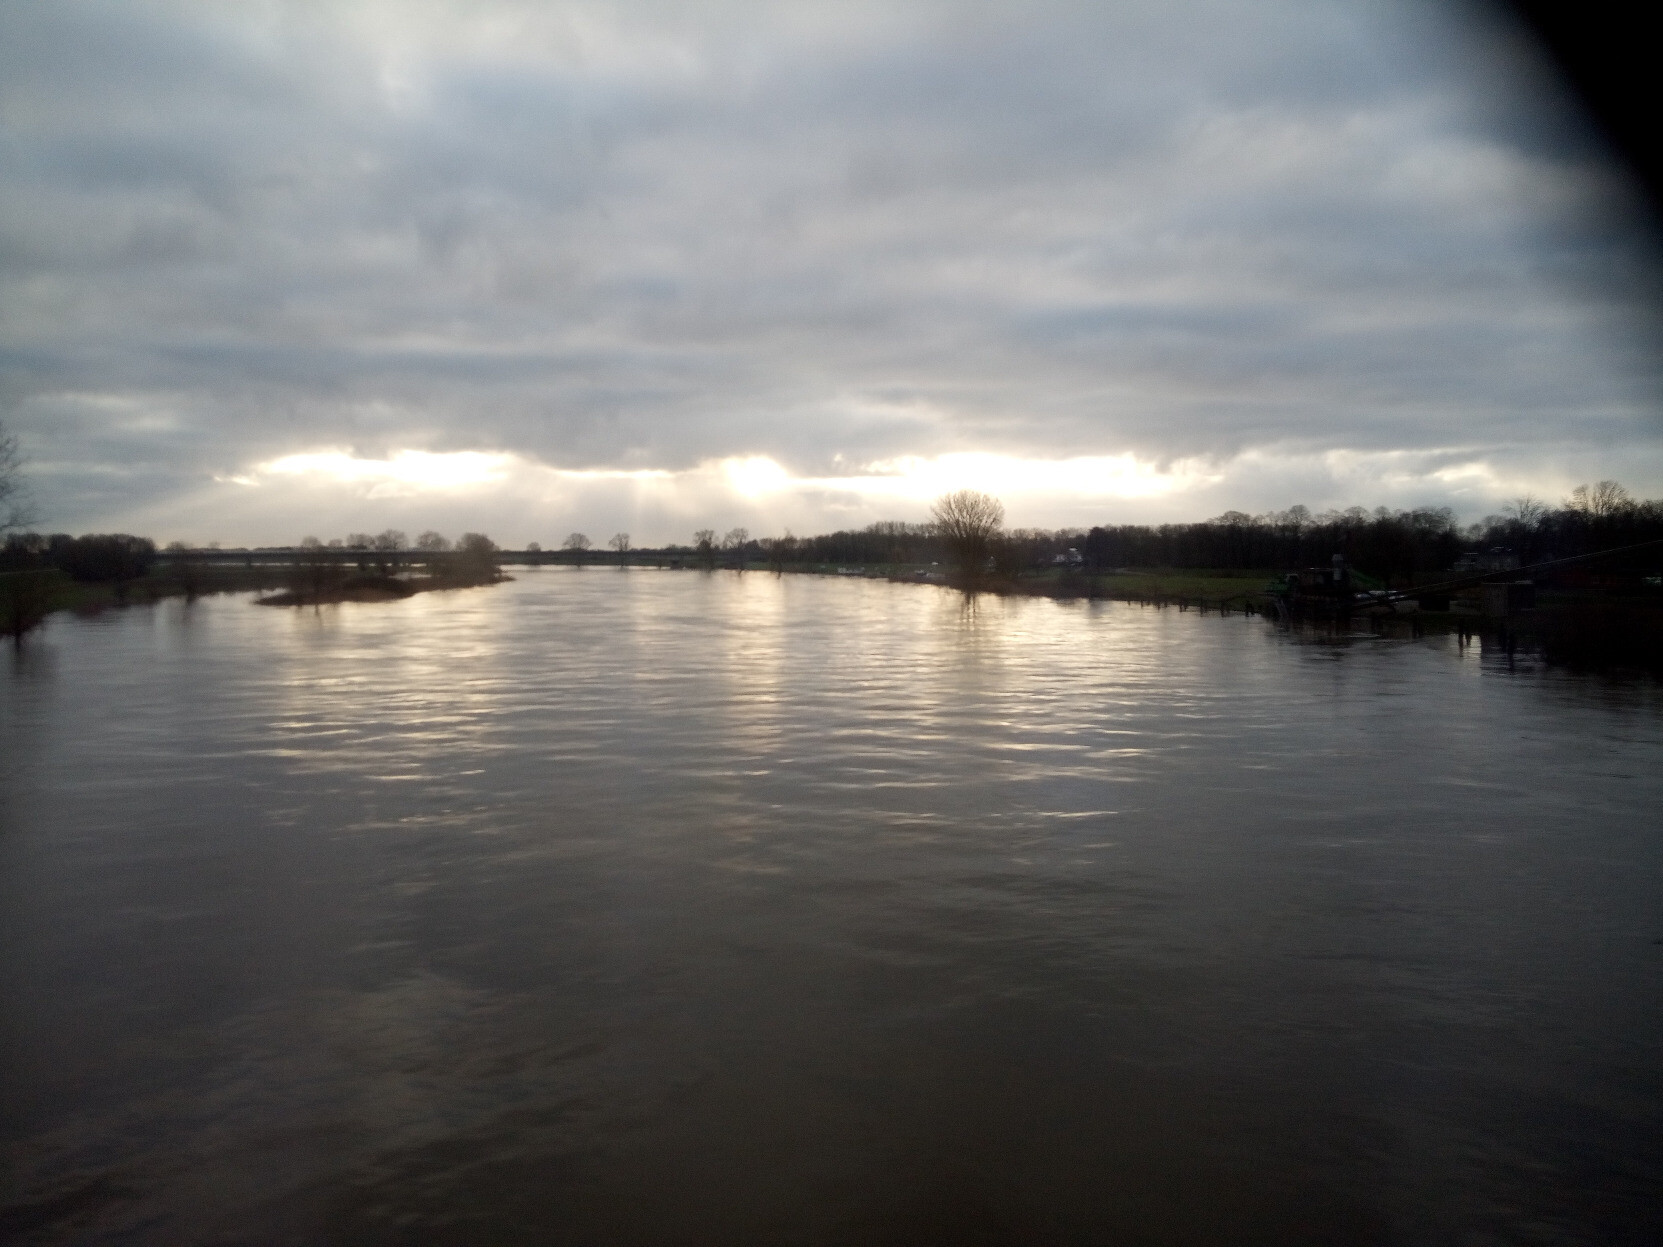
Encountered some rays from the clouds on my way to the hospital
My mood regarding #Atoki stateres design right now
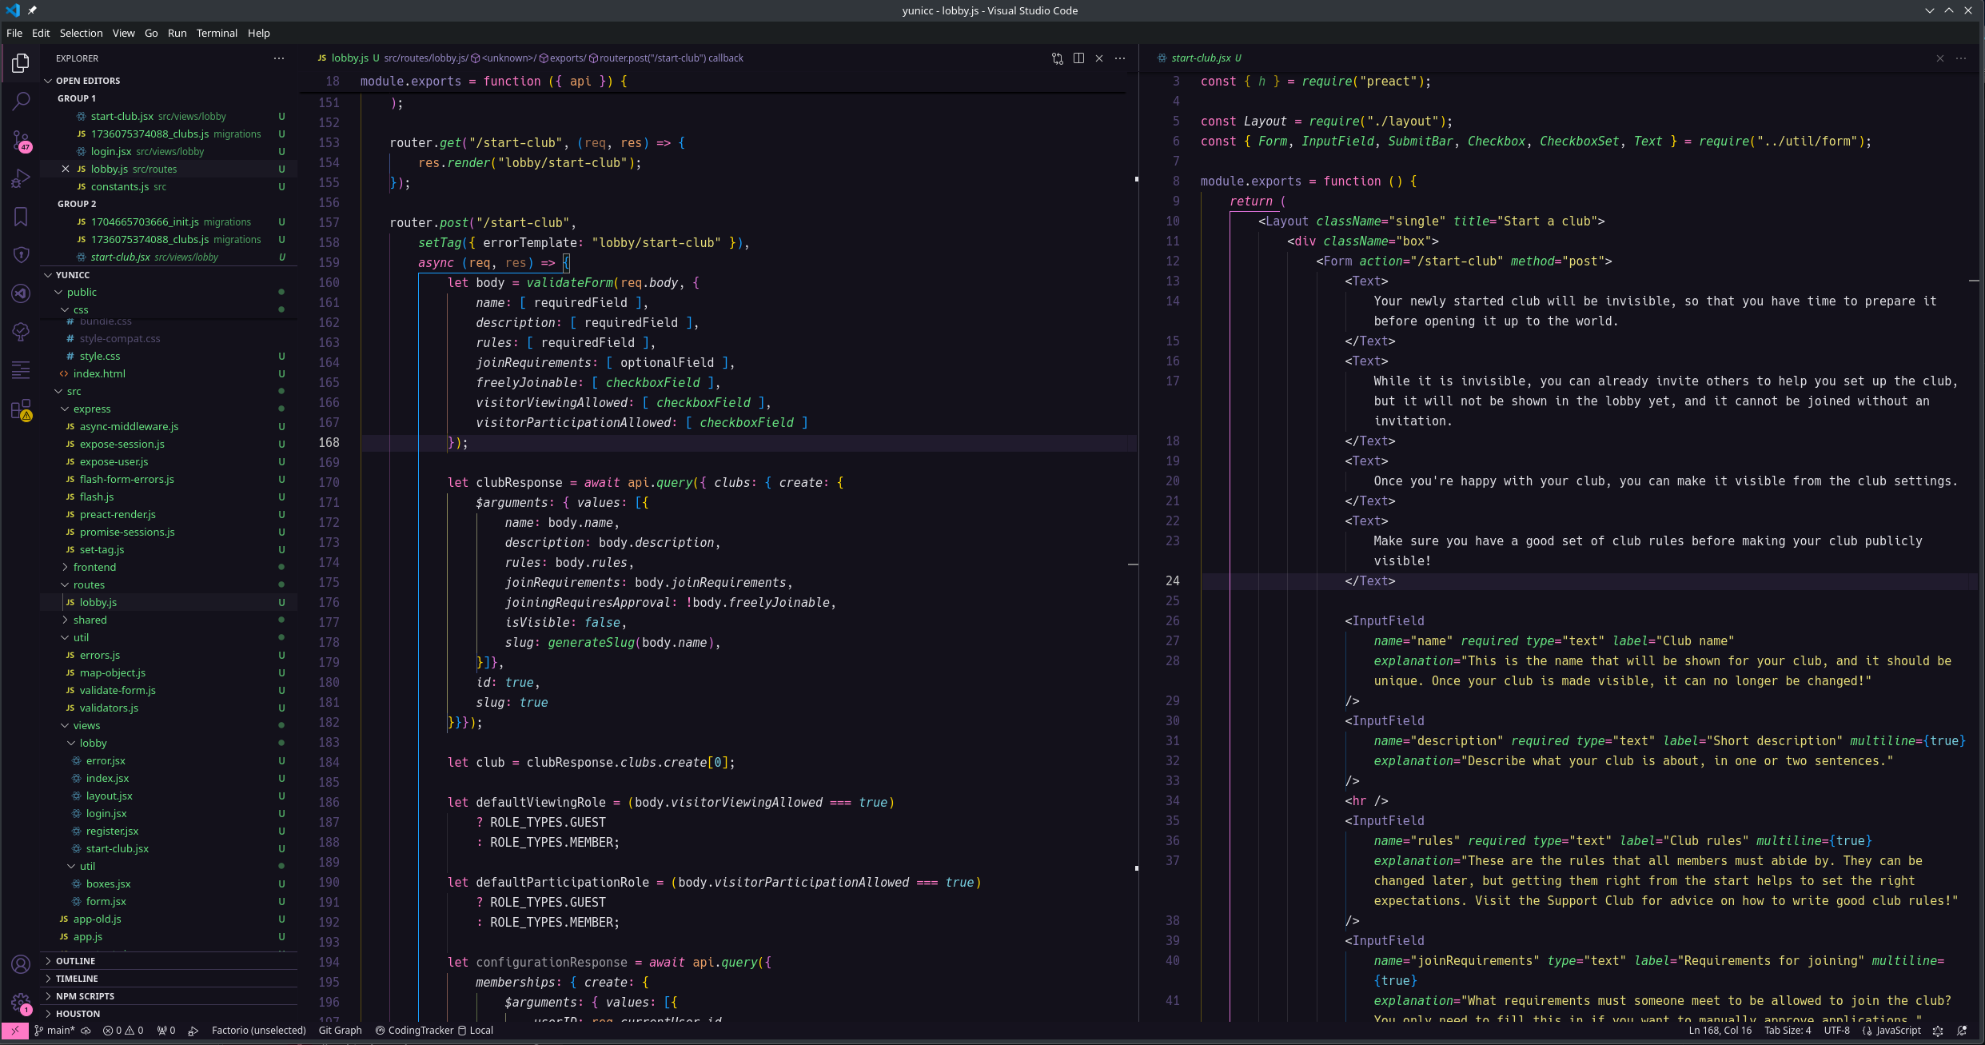
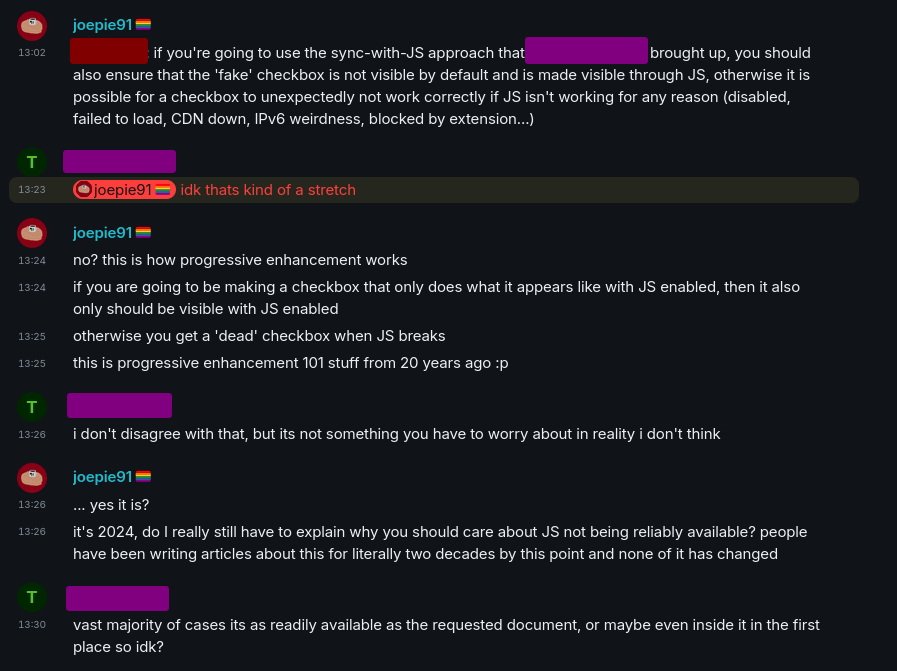
If you've ever wondered why so many websites are a fragile JS hellscape, here's what a typical conversation in a web development channel might look like, and I think that tells you all you need to know
Don't mind me, just implementing automatic image hiding and album grouping in my #Matrix client
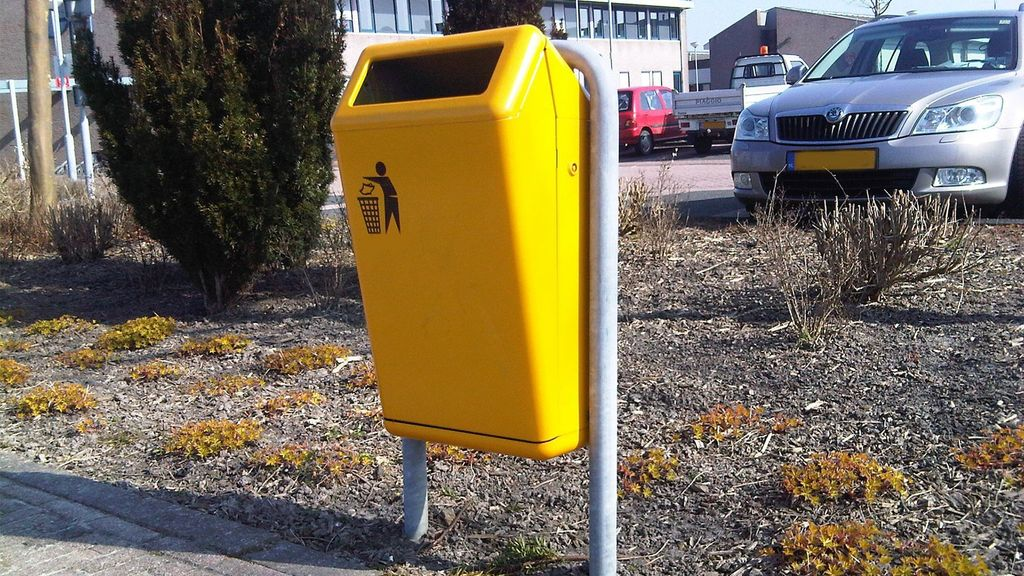
Today in more obscure news: the manufacturer of the de-facto standard municipal trashbin in the Netherlands, has declared bankrupcy
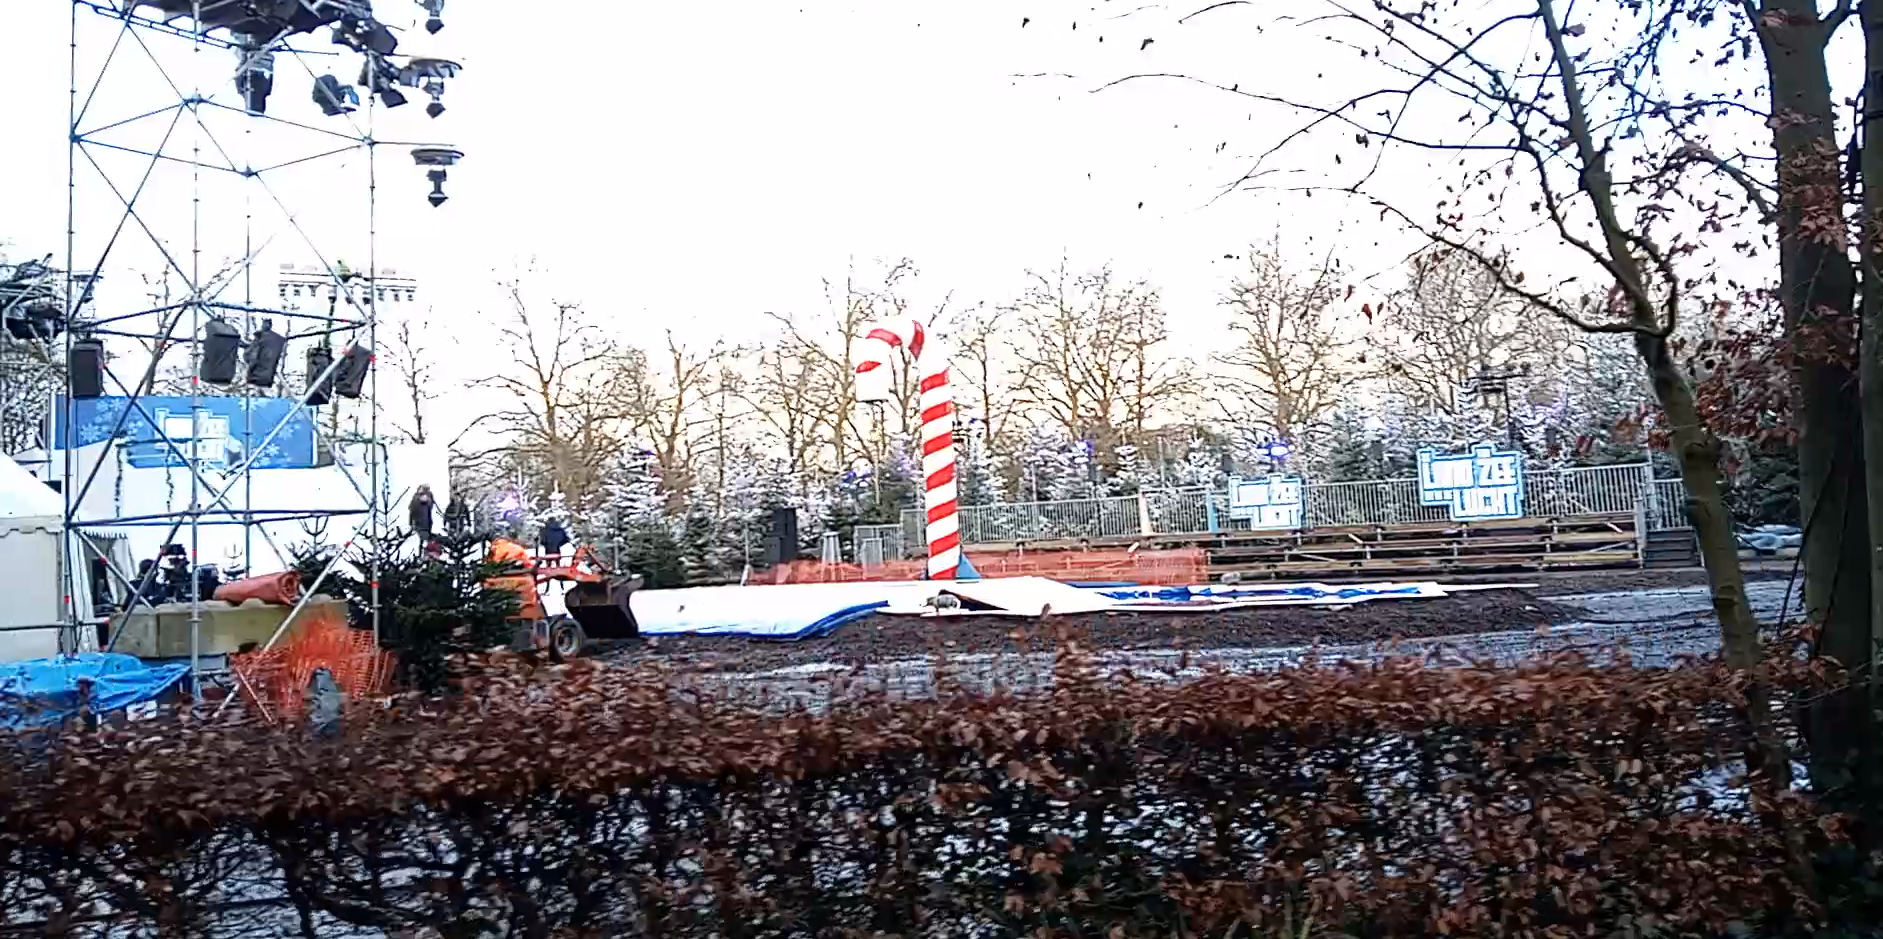
Voorbereidingen voor Te Land, Ter Zee En In De Lucht in de Efteling
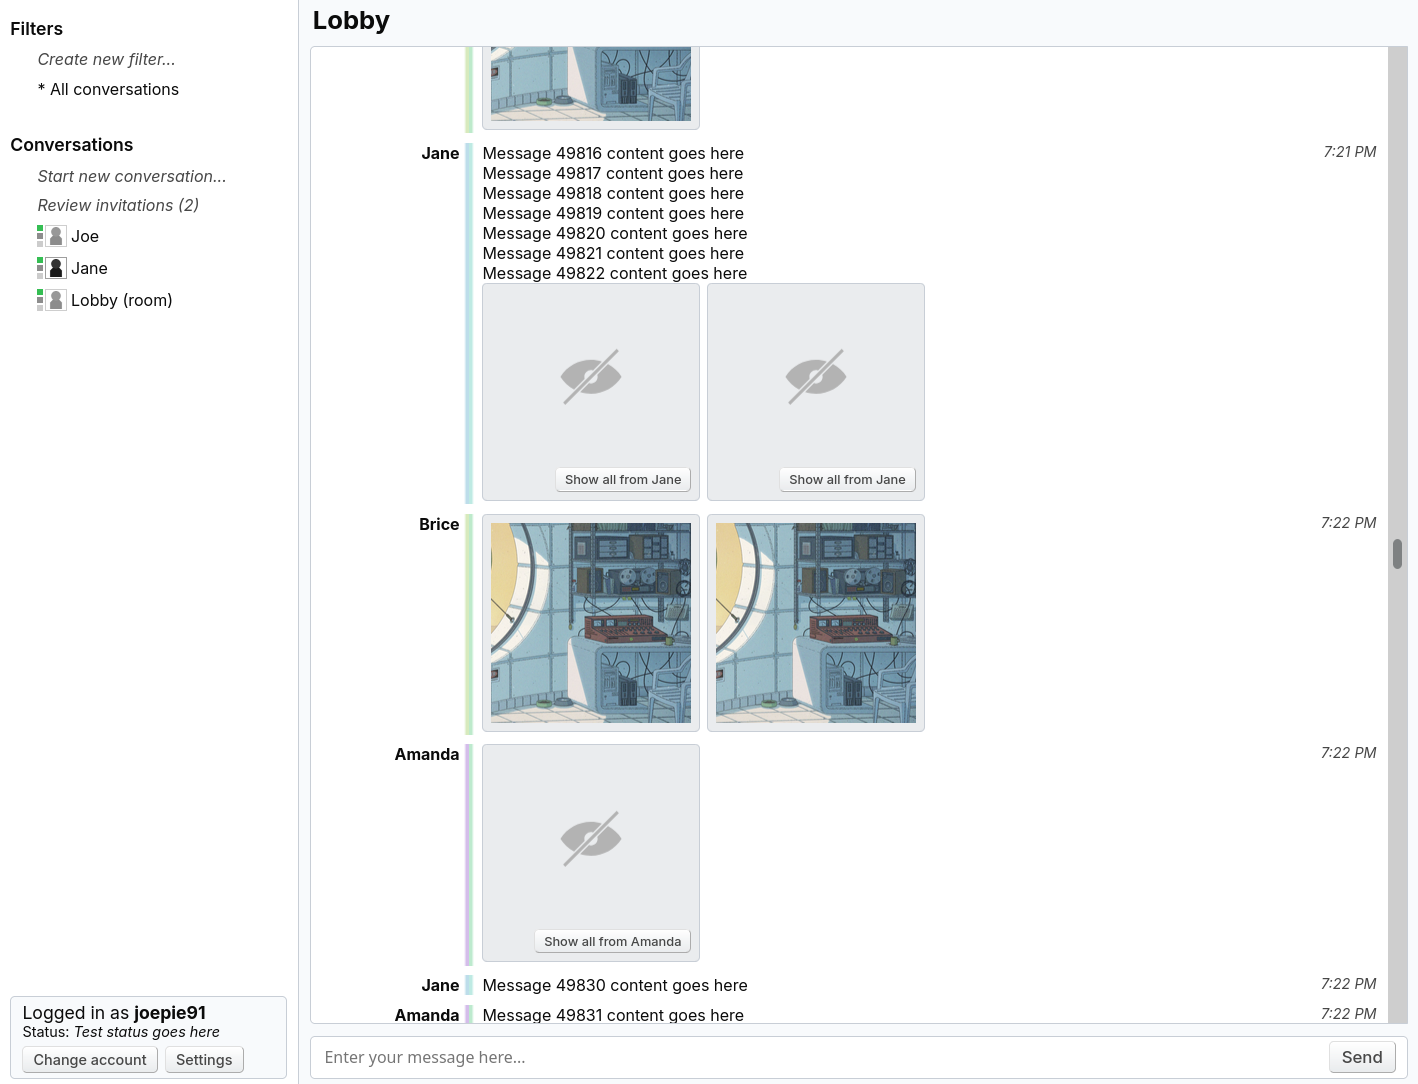
Experimenting with a design idea for a low-stimuli chat client, specifically the visualization of unread messages and notifications (I cannot sufficiently express my burning hatred for anxiety-inducing bright-red-background notification counts)
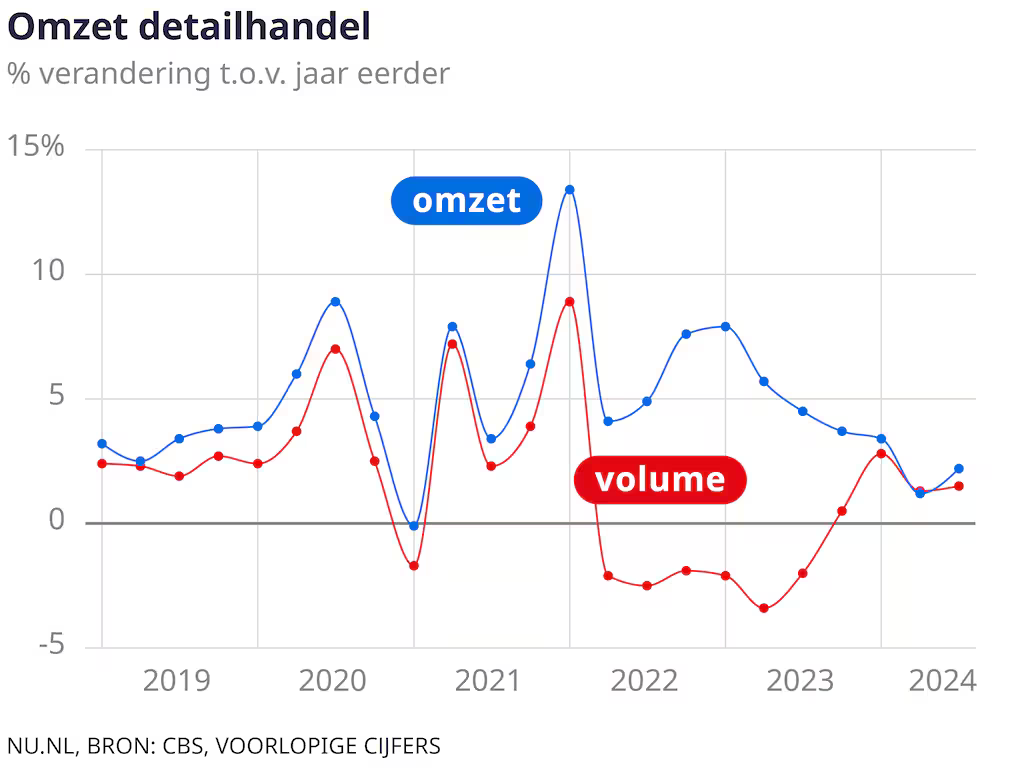
This is a graph from a Dutch news article about changes in revenue (blue) and sales volume (red) in the Dutch retail industry. Above 0 means it went up, below 0 means it went down, compared to the previous year. The massive dip in volume are the years in which there were COVID measures.
But I want to draw your attention to the "revenue" line. Notice how it doesn't meaningfully dip compared to previous years, and revenues continued to climb, *even though* the sales volume decreased?
Next time someone tells you that ever-increasing consumerism is necessary to keep the economy running, remember this graph.
(The CBS, which is the data source for this graph, is the Dutch governmental statistics agency.)
- Future new account
- @joepie91@slightly.tech
- Matrix
- @joepie91:pixie.town
- Pronouns
- they/them, he/him, whatever, it's not like I have any idea either 🙃
In the process of moving to @joepie91. This account will stay active for the foreseeable future! But please also follow the other one.
Technical debt collector and general hype-hater. Early 30s, non-binary, ND, poly, relationship anarchist, generally queer.
- No alt text (request) = no boost.
- Boosts OK for all boostable posts.
- DMs are open.
- Flirting welcome, but be explicit if you want something out of it!
- The devil doesn't need an advocate; no combative arguing in my mentions.
Sometimes horny on main (behind CW), very much into kink (bondage, freeuse, CNC, and other stuff), and believe it or not, very much a submissive bottom :p
My spoons are limited, so I may not always have the energy to respond to messages.
Strong views about abolishing oppression, hierarchy, agency, and self-governance - but I also trust people by default and give them room to grow, unless they give me reason not to. That all also applies to technology and how it's built.
Joined Aug 2019