
contains code, screenreader-unfriendly
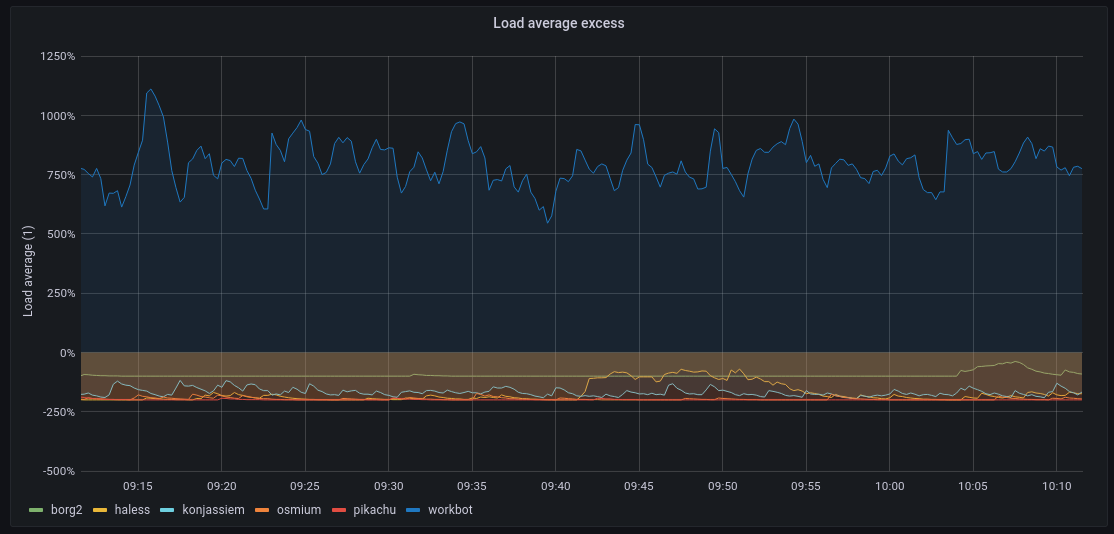
More seriously, if you're running system graphs, I *strongly* recommend adding an 'excess load average' metric, which shows you not just the load average but how much of it exceeds the available CPU cores. Below 0% = healthy system, above 0% = overloaded system. Much more representative than load averages themselves!
This is the Prometheus query I use:
(avg by(instance)(node_load1)) - (count(node_cpu_seconds_total{mode=\"idle\"}) without (cpu,mode,job))