
Follow
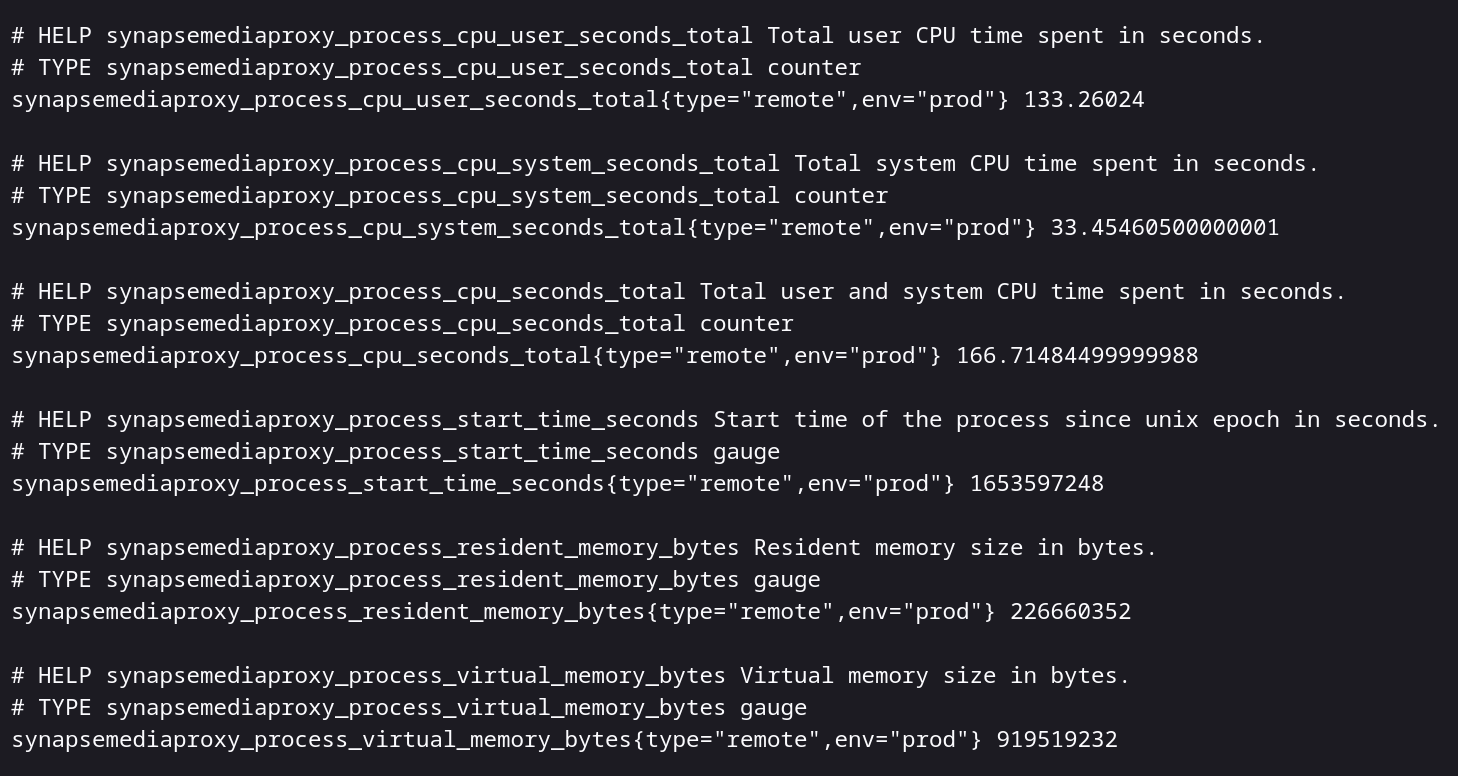
@morgan@cathode.church https://xeiaso.net/blog/prometheus-grafana-loki-nixos-2020-11-20 is a bit NixOS centric, but basically you set up Prometheus to store your data, and configure the various HTTP servers/routes it has to scrape for data (prometheus-node-exporter for system stats of the server, and your various software that has metrics), then configure Grafana to add that prometheus instance as a datasource